The 30th month of state and local Hepatitis A outbreaks is in the books with no end in sight. And while food and water contamination is often the thing that comes to mind, the federal Centers for Disease Control and Prevention says hepatitis A is most often spread by person-to-person contact.
Food and water contamination are part of the mix and infected restaurant workers around the country are responsible for spreading hepatitis A from at-risk groups to the general population. By all means, during the 30-month period from March 2017 to August 2019, the number of hepatitis A infections has reached 24,952 with14,984 or 60 percent requiring hospitalization. And 244 deaths are attributed to the hepatitis A infections.
High-risk groups for or acquiring HAV infection or developing serious complications from HAV infection in these outbreaks include:
- Injection or non-injection drug users.
- People living without housing.
- Men who have sex with men.
- Incarcerated or recently incarcerated people
- Anyone with chronic liver disease, including cirrhosis, hepatitis B, or C.
CDC supports aggressive vaccination campaigns against hepatitis A, like those many state and local health departments are currently waging. The agency says one dose of single-antigen hepatitis A vaccine has been shown to control outbreaks of hepatitis A and provides up to 95 percent seroprotection in healthy individuals for up to 11 years. Pre-vaccination serologic testing is not required to administer hepatitis A vaccine. Vaccinations should not be postponed if vaccination history cannot be obtained or records are unavailable.
CDC has provided outbreak-specific considerations for hepatitis A vaccine administration.
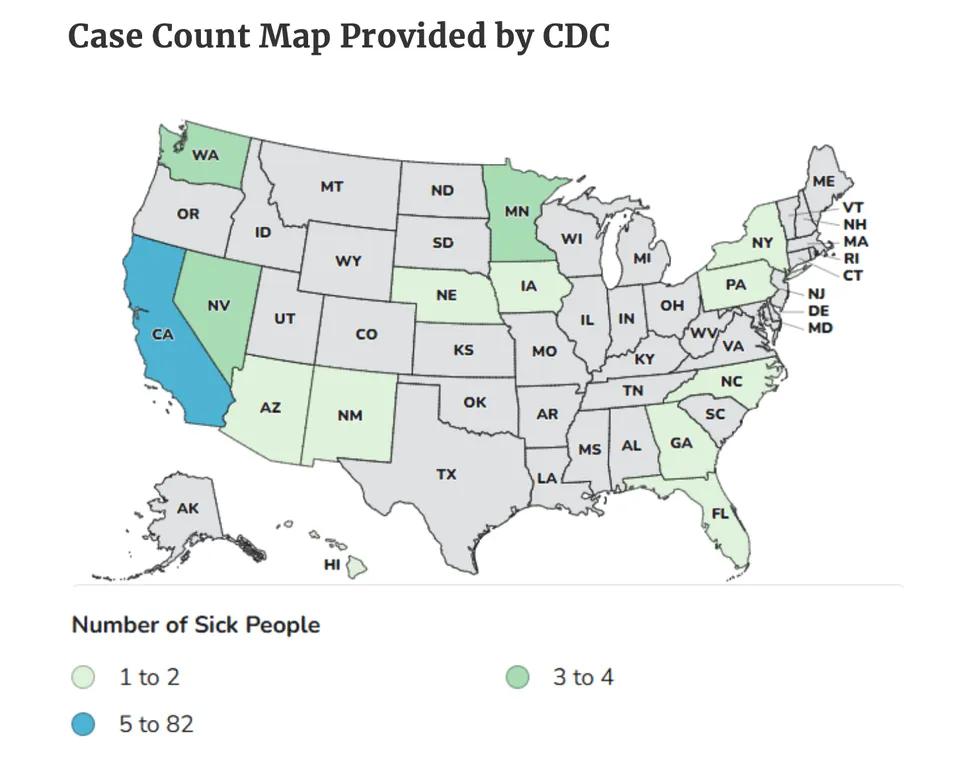
State-Reported Hepatitis A Outbreak Cases as of August 30, 2019

| State | Case Total | Hospitalizations n (%) |
Deaths | Outbreak Start Date |
Data Current Through |
|---|---|---|---|---|---|
| Total | 24952 | 14984 (60%) | 244 | ||
| States with an ongoing outbreak | |||||
| Alabama | 132 | 74 (56%) | NR | 9/1/2018 | 8/14/2019 |
| Arizona | 555 | 444 (80%) | 6 | 11/1/2018 | 8/29/2019 |
| Arkansas | 405 | 205 (51%) | 3 | 2/7/2018 | 8/30/2019 |
| Colorado | 140 | 102 (73%) | 0 | 10/1/2018 | 8/28/2019 |
| Florida | 2586 | 1859 (72%) | 31 | 1/1/2018 | 7/31/2019 |
| Georgia | 611 | 416 (68%) | 4 | 6/1/2018 | 8/24/2019 |
| Idaho | 53 | 29 (55%) | 0 | 1/1/2019 | 8/30/2019 |
| Illinois | 153 | 100 (65%) | 1 | 9/1/2018 | 8/28/2019 |
| Indiana | 2043 | 1129 (55%) | 4 | 11/1/2017 | 8/30/2019 |
| Kentucky | 4870 | 2358 (48%) | 61 | 8/1/2017 | 8/17/2019 |
| Louisiana | 504 | 292 (58%) | 1 | 1/1/2018 | 8/30/2019 |
| Massachusetts | 502 | 398 (79%) | 7 | 4/1/2018 | 8/23/2019 |
| Michigan | 918 | 737 (80%) | 30 | 8/1/2016 | 8/28/2019 |
| Minnesota | 26 | 17 (65%) | 0 | 12/16/2018 | 8/23/2019 |
| Mississippi | 31 | 20 (65%) | 0 | 4/1/2019 | 8/26/2019 |
| Missouri | 424 | 237 (56%) | 2 | 9/1/2017 | 8/27/2019 |
| Nevada | 86 | 74 (86%) | 1 | 11/1/2018 | 8/26/2019 |
| New Hampshire | 180 | 106 (59%) | 1 | 11/1/2018 | 8/20/2019 |
| New Jersey | 361 | 240 (66%) | 4 | 12/1/2018 | 8/17/2019 |
| New Mexico | 140 | 109 (78%) | 2 | 11/8/2018 | 8/29/2019 |
| North Carolina | 90 | 61 (68%) | 1 | 1/1/2018 | 8/20/2019 |
| Ohioexternal icon | 3274 | 2003 (61%) | 16 | 1/1/2018 | 8/26/2019 |
| Pennsylvania | 443 | 335 (76%) | 7 | 1/1/2018 | 8/24/2019 |
| South Carolina | 352 | 234 (66%) | 1 | 11/1/2018 | 8/23/2019 |
| Tennessee | 2361 | 1419 (60%) | 14 | 12/1/2017 | 8/30/2019 |
| Virginia | 155 | 96 (62%) | 0 | 1/1/2019 | 8/29/2019 |
| Washington | 21 | 14 (67%) | 0 | 4/1/2019 | 8/29/2019 |
| West Virginia | 2547 | 1260 (49%) | 23 | 3/19/2018 | 8/30/2019 |
| States with a declared end to their outbreak | |||||
| California | 708 | 464 (66%) | 21 | 11/1/2016 | 4/11/2018 |
| Utah | 281 | 152 (54%) | 3 | 5/8/2017 | 2/12/2019 |
NR: not publicly reported
- “Outbreak-associated” status is currently determined at the state level in accordance with each state’s respective outbreak case definition.
- Outbreak-related hepatitis A deaths are defined at the state level in accordance with each state’s respective hepatitis A-related death definition. Some states are reviewing death certificates on a regular basis to actively find hepatitis A-related deaths, while other states are utilizing passive surveillance.
- Outbreak start date is defined at the state level and may represent the earliest onset date of an outbreak case (AR, AZ, UT), the left censor date for which cases are considered part of the outbreak based on the state outbreak case definition (AL, CA, CO, FL, GA, ID, IL, IN, KY, LA, MA, MI, MN, MO, MS, NV, NH, NJ, NC, OH, PA, SC, TN, VA, WA), or when a state declared a hepatitis A outbreak (NM, WV).
(To sign up for a free subscription to Food Safety News, click here.)